 The QUONAE GroupCompass
Compass Profile
The QUONAE GroupCompass
Compass Profile
The QUONAE GroupCompass
Compass Profile
The QUONAE GroupCompass
Compass Profile


We're heading into fall with the highest mortgage rates of the year, and the market is shifting. Buyers are making fewer offers, more homes are sitting on the market, and more sellers are cutting their asking price. Prices are usually the last thing to move in a slowdown, but we're starting to see early changes, and this brief walks through what the latest numbers mean whether you plan to buy, sell, or wait.
By Nicole Protheroe · The QUONAE Group at Compass · October 6, 2026
Freddie Mac's weekly survey put the average 30-year mortgage rate at 7.28% on October 1, up from 7.03% a week earlier and 6.34% a year ago.[1] That is the highest weekly average since November 2023.[2] Higher rates raise the monthly payment on any given loan, so fewer buyers are able or willing to make offers, and homes take longer to sell. For more on what drives mortgage rates, see Issue 03 and Issue 04, and for a wider view of September, see our National Market Report (Issue 06).[6]
Housing economist Mike Simonsen of Compass International Holdings tracks the national market every week using Altos Research data.[3] Here is where things stood in his October 5 update.
| Measure | This week | vs. last year |
|---|---|---|
| Homes for sale (inventory) | 1.14 million | up 4.4% |
| New listings this week | 78,000 | down about 1% |
| New contracts (pending sales) | 69,000 | down 10.5% |
| Asking price per square foot | $213 | down 1.3% |
| Listings with a price cut | 42.8% | above this point in 2022 |
Inventory grew by about 8,000 homes this week, which is the largest gain for this week of the year in at least a decade.[3] New listings are slightly lower than last year, though, so the growth comes from homes taking longer to sell rather than from more owners deciding to list. This week, about 9,000 more homes came on the market than went under contract, and that gap is what keeps adding to the supply.
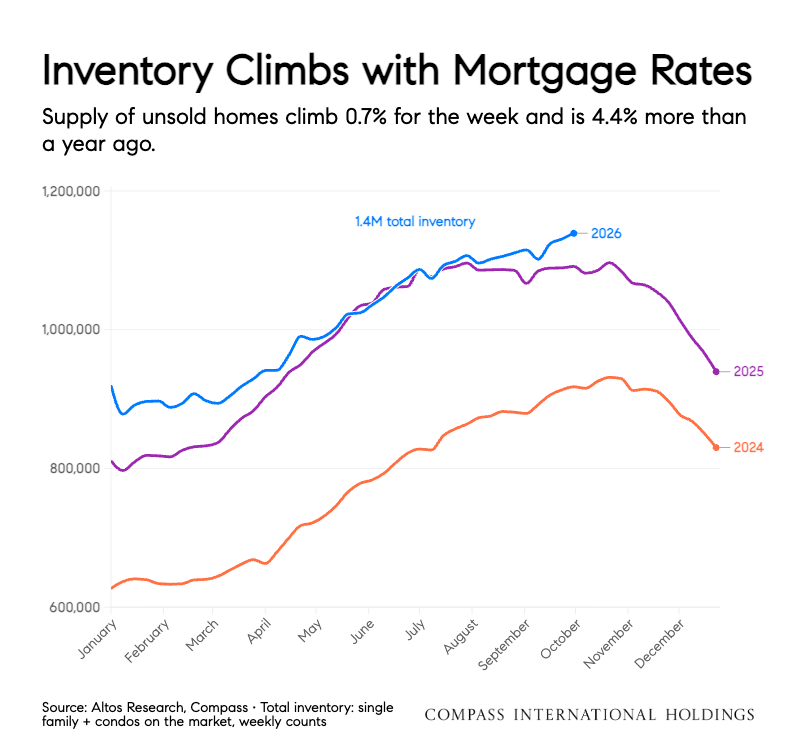
Figure 1. “Inventory Climbs with Mortgage Rates.” Chart: Compass International Holdings; data: Altos Research, total single-family and condo inventory on the market, weekly counts. Used with permission.[4] How to read it: each line is one year, from January to December. The blue 2026 line sits above last year's purple line, so more homes are for sale now than at this time in 2025, about 1.14 million compared with about 1.09 million. The label on the chart reads “1.4M,” but the plotted line and the weekly data both put inventory at about 1.14 million.Legend: blue = 2026; purple = 2025; orange = 2024.
| Year | Homes for sale, early October |
|---|---|
| 2026 | about 1.14 million (latest) |
| 2025 | about 1.09 million |
| 2024 | about 920,000 |
2026 value from the October 5 weekly update; 2025 and 2024 values read from the chart and approximate. Source: Compass International Holdings, Altos Research data.
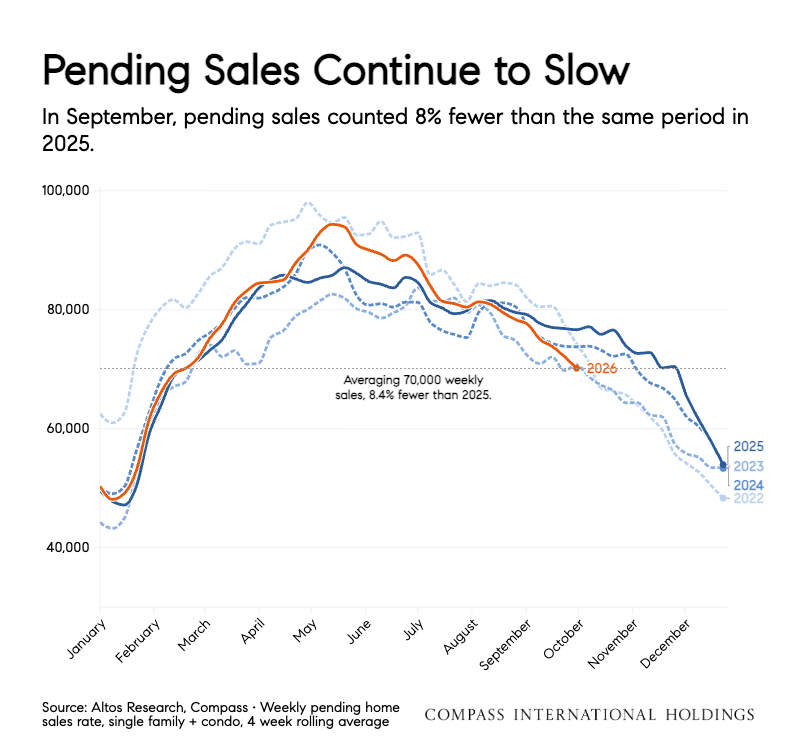
Figure 2. “Pending Sales Continue to Slow.” Chart: Compass International Holdings; data: Altos Research, weekly pending home sales, single-family and condo, 4-week rolling average. Used with permission.[4] How to read it: a pending sale is a home that has gone under contract but hasn't closed yet. The orange 2026 line ran above the other years in May and June, then dropped below them over the summer. In September, sales averaged about 70,000 a week, 8.4% fewer than in September 2025.Legend: orange = 2026; solid dark blue = 2025; dashed blue lines = 2024 and 2023; light dashed blue = 2022. The dotted line marks 70,000 sales a week.
| Measure | Value |
|---|---|
| New contracts, latest week | 69,000 (down 10.5% from last year) |
| September weekly average | about 70,000 (down 8.4% from September 2025) |
| 2026 peak (late May) | about 94,000 (read from chart) |
Source: Compass International Holdings, Altos Research data; Mike Simonsen weekly update, October 5, 2026.
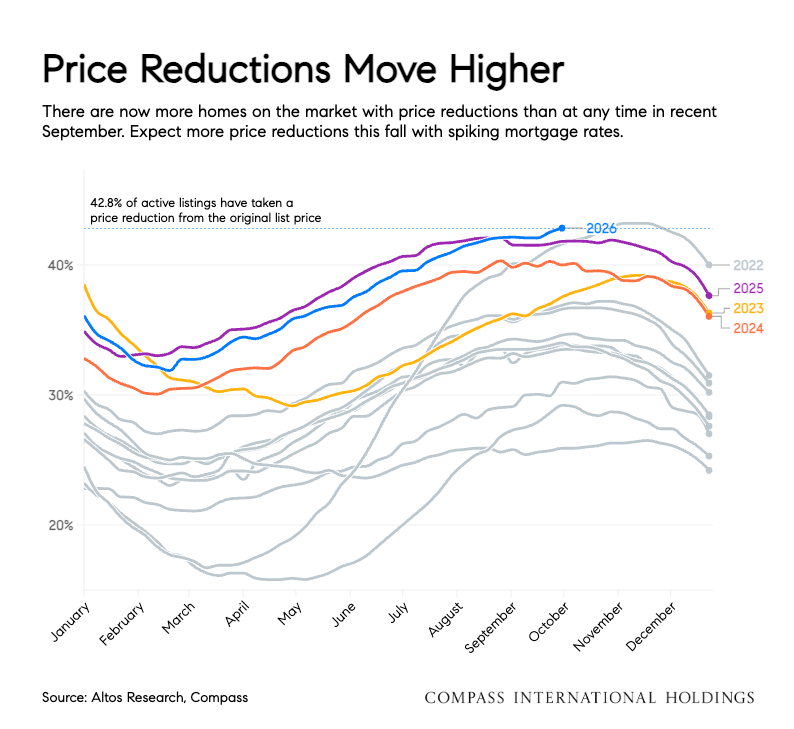
Figure 3. “Price Reductions Move Higher.” Chart: Compass International Holdings; data: Altos Research, share of active listings that have cut their price from the original list price. Used with permission.[4] How to read it: each line is one year. A higher line means more sellers have lowered their asking price. The blue 2026 line is at 42.8%, at or above every other year shown for early October, including 2022, when rates rose quickly.Legend: blue = 2026; purple = 2025; orange = 2024; yellow = 2023; gray = 2022 and earlier years. The dotted line marks 42.8%.
| Year | Share of listings with a price cut, early October |
|---|---|
| 2026 | 42.8% (latest) |
| 2025 | about 42% (read from chart) |
| 2024 | about 40% (read from chart) |
| 2023 | about 37% (read from chart) |
Source: Compass International Holdings, Altos Research data.
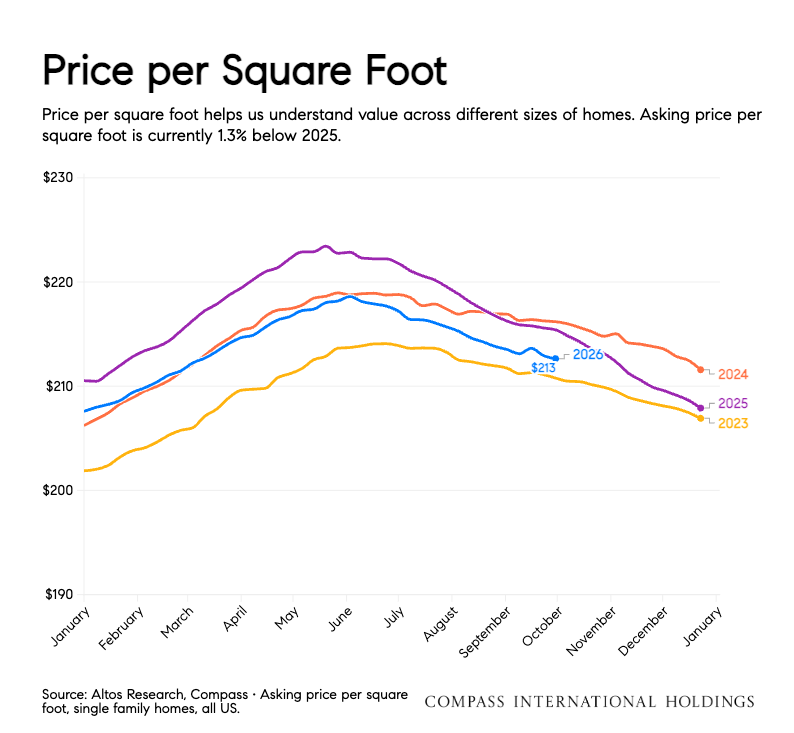
Figure 4. “Price per Square Foot.” Chart: Compass International Holdings; data: Altos Research, asking price per square foot, single-family homes, all U.S. Used with permission.[4] How to read it: price per square foot lets you compare value across homes of different sizes. The blue 2026 line, at $213, sits just below last year's purple line, which means asking prices are about 1.3% lower than a year ago. The scale starts at $190, so small differences look bigger than they are.Legend: blue = 2026; purple = 2025; orange = 2024; yellow = 2023.
| Year | Asking price per sq ft, early October |
|---|---|
| 2026 | $213 (latest) |
| 2025 | about $216 (read from chart) |
| 2024 | about $216 (read from chart) |
| 2023 | about $211 (read from chart) |
Source: Compass International Holdings, Altos Research data. Single-family homes only.
When the market slows, it's natural to wonder whether foreclosures are coming. Based on the data we're watching, we don't expect a wave of foreclosures or distressed sellers in the near future.[3] Most homeowners have affordable existing payments because many locked in lower rates, equity is strong after several years of price growth, and unemployment remains low in most of the country. Homeowners in that position can usually keep paying their mortgage, so they aren't forced to sell.
What we may see instead is more motivated sellers. These are owners who want or need to move for a new job, a change in their household, or another reason, and who are willing to negotiate to get it done. We may also see more short sales from people who bought in the last four years with small down payments. A short sale happens when a home sells for less than the owner still owes on the mortgage and the lender agrees to accept the lower amount. Owners who put little money down and bought near the recent price peak have the least equity to fall back on if prices soften.[3]
For buyers, motivated sellers can create real opportunity. For sellers, it means the homes you're competing with may be more flexible on price and terms than they were a year ago. No one can predict exactly how this will play out, and conditions can change quickly if rates or the job market shift.
The slowdown is clear at the national level, but local markets don't all move together. Altos Research counted about 7,800 immediate sales this week, meaning homes that went under contract almost as soon as they were listed.[3] Those tend to be well-presented homes that are priced right from the start. The most expensive segment of the market also still has more sales than a year ago, while lower-priced homes have slowed more noticeably.[3] That's why national headlines only tell part of the story for any one town or price range.
For the most part, yes. Home sales follow a seasonal rhythm every year. Contracts usually peak in late spring and then fall through the summer and into autumn as fewer buyers shop heading into the colder months, while the number of homes for sale keeps building because homes listed in the spring are still on the market. To see whether 2026 is following that pattern, we compared it with every year since 2017 using Realtor.com's monthly national data, published by the Federal Reserve Bank of St. Louis.[7] We left out 2020 and 2021 because the pandemic broke the usual seasonal pattern in those years.
| Measure (U.S.) | 2026 | Usual range* | Normal? |
|---|---|---|---|
| Contracts, spring peak to September | -16.8% | -8.7% to -17.7% (avg. -13.0%) | Yes, on the steeper side |
| Homes for sale, May to September | +9.7% | +3.7% to +52.6% (avg. +17.0%) | Yes |
| Asking price per sq ft, summer peak to September | -2.2% | 0.0% to -3.4% (avg. -1.9%) | Yes |
| Share of listings that cut their price in September | 35.0% | 29.5% to 43.6% (avg. 35.0%) | Yes, right at the average |
*Lowest to highest of 2017, 2018, 2019, 2022, 2023, 2024 and 2025. Our calculations from Realtor.com data via FRED.[7]
Figure 5. Every year, contracts fall from the spring peak to September. Monthly U.S. pending listings, 2017 to September 2026, excluding 2020 and 2021. Data: Realtor.com, via FRED.[7] Chart by The QUONAE Group. How to read it: each bar shows how much the number of homes under contract fell from that year's spring high to September. Every bar points down, so a fall slowdown happens every year. The 2026 bar (-16.8%) is longer than the average (-13.0%), but it is about the same as 2017, 2018 and 2022.Legend: black bar = 2026; gray bars = earlier years; dotted line = average of the gray bars.
| Year | Peak month | Pending at peak | Pending in Sept. | Change |
|---|---|---|---|---|
| 2017 | May | 449,129 | 369,426 | -17.7% |
| 2018 | May | 443,974 | 370,589 | -16.5% |
| 2019 | Jun | 455,592 | 415,950 | -8.7% |
| 2020 | Jul | 611,586 | 628,137 | +2.7% |
| 2021 | Jun | 659,597 | 611,800 | -7.2% |
| 2022 | May | 562,265 | 465,975 | -17.1% |
| 2023 | May | 460,100 | 409,126 | -11.1% |
| 2024 | May | 472,405 | 422,157 | -10.6% |
| 2025 | May | 487,034 | 440,887 | -9.5% |
| 2026 | May | 508,202 | 422,936 | -16.8% |
Monthly counts of U.S. pending listings (PENLISCOUUS), Realtor.com via FRED, retrieved October 6, 2026. Peak month is the highest month from March to July. 2020 and 2021 are shown here but left out of the chart and the usual range.
What stands out this year is the level, not the pattern. By this measure, contracts in September were about -4.1% lower than in September 2025, the first year-over-year drop for September since 2023. The spring peak in 2026 was also the highest since 2022, so part of the steeper fall decline comes from starting at a higher point. Homes for sale reached about 1.16 million in September, the most for that month since 2019.[7] Altos Research's weekly data, shown earlier, puts the gap with last year at 10.5% for the most recent week, because it captures the latest weeks of rising rates.[3]
The price-cut numbers also depend on how they are counted. Realtor.com counts listings that cut their price during the month, and by that measure September 2026 is right at the average. Altos Research counts every listing that has cut its price at any point since it was listed, and by that measure 42.8% is higher than at this time in any recent year.[3][7] Taken together, the data supports what we're seeing day to day. A fall slowdown is normal, and this one fits the usual pattern, though it's on the steeper side and is happening alongside higher rates. No one can predict exactly how the rest of the season will unfold.
Nationally, the cost of buying a home is up, sales are slower, and the slowdown is broad. Home prices haven't reacted much yet, so the number of motivated sellers is worth watching as we head into 2027.[3]
If you're buying, more homes for sale and more price cuts can mean more choices and more room to negotiate on price, closing-cost credits, repairs, or a rate buydown. If you're selling, pricing correctly from the first day matters more now than it has in years, since 42.8% of listings have already had to lower their price. We compared how a price cut and a rate buydown each change a buyer's monthly payment in Issue 05: Price Cut or Rate Buydown?[5] Either way, this information is useful to both buyers and sellers, and the right move depends on your own goals and timeline.
The QUONAE Group tracks these numbers every week so we can help you price, negotiate, and time your next move with real data. Reach out to find out more.
Reach out to Nicole to see what this means in your area, across the Greater Boston Area, its surrounding suburbs, and the North Shore.
Email NicoleMortgage rates are at their highest level in almost three years. Freddie Mac's weekly average reached 7.28% on October 1, 2026. Higher payments have reduced the number of buyers, so new contracts are running about 10.5% below last year and homes are taking longer to sell.
Not in the near future, based on current data. Most homeowners have affordable existing payments, strong equity, and stable jobs. More motivated sellers and some short sales among recent buyers with small down payments are possible, but conditions can change.
Only slightly so far. The national asking price per square foot was $213 in early October 2026, about 1.3% lower than a year earlier, while 42.8% of active listings had taken a price cut, according to Altos Research data.
Yes, for the most part. Every year since 2017, apart from the pandemic years of 2020 and 2021, pending sales have fallen from their spring peak to September, by 8.7% to 17.7%. In 2026 they fell 16.8%, on the steeper side of that range, and price cuts and inventory growth are also within their usual ranges, according to Realtor.com data published by the St. Louis Fed.
Nicole Protheroe is not a licensed loan officer. Rate, loan, and buydown information in this brief is based on the cited sources, which are subject to change. Clients are always free to choose their own lender. For guidance on your own loan, please speak with a licensed loan officer.
Weekly market figures come from Mike Simonsen's October 5, 2026 update (Altos Research data) and were checked against the Compass International Holdings charts shown in Figures 1–4. The inventory chart's printed label reads “1.4M”; the plotted line and the weekly update both put inventory at about 1.14 million, so this brief uses 1.14 million. Values marked “read from chart” are approximate. Figure 5 and the seasonal comparison table were built by The QUONAE Group from Realtor.com monthly data published on FRED; 2020 and 2021 are excluded from the usual range because pandemic conditions disrupted normal seasonality, and the price-cut share is the monthly price-reduced count divided by active listings. Calculations in the “Show the math” pop-ups are our own and use the rounded figures as published. Quoted text is limited to the original chart titles, which appear in quotation marks. All figures are point-in-time and subject to change.
The QUONAE Group provides the same information to all clients. We encourage every client to research schools and communities independently. The QUONAE Group does not steer anyone toward or away from any school, neighborhood, or property.
How much rates have risen
Why inventory keeps growing
The 9,000 gap is close to the 8,000-home weekly gain. The two don't match exactly because some homes also leave the market without selling, for example when a listing is withdrawn or expires.
Pending sales vs. last year
Asking price per square foot vs. last year
Asking prices are list prices, not final sale prices.
2026 compared with prior years
Monthly data from Realtor.com via FRED, retrieved October 6, 2026. Price per square foot is the median listing price per square foot, rounded to whole dollars by the source.