 The QUONAE GroupCompass
Compass Profile
The QUONAE GroupCompass
Compass Profile
The QUONAE GroupCompass
Compass Profile
The QUONAE GroupCompass
Compass Profile


Mortgage rates have climbed this fall, and it's easy to assume the window to buy or sell has closed. The data tells a more mixed story. This brief looks at where rates, inventory, and prices stand today and how each could affect your next move, whether you plan to buy, sell, or wait.
By Nicole Protheroe · The QUONAE Group at Compass · September 24, 2026
Freddie Mac's weekly survey, a long-running national benchmark, put the average 30-year mortgage rate at 7.03% on September 24, its first reading above 7% since January 2025.[1][3] Two weeks earlier the average was 6.76%, and a year ago it was 6.30%.[1]
Last week, the Federal Reserve raised its benchmark short-term rate by 0.25 percentage points, to a range of 3.75% to 4.00%, because inflation has been slower to cool than expected.[4][11] That doesn't automatically change mortgage rates. Mortgage rates follow the 10-year Treasury yield, which is the rate the U.S. government pays to borrow money for 10 years. That yield is now near 5%, its highest level in almost 20 years.[4][9] For a closer look at how the Fed and mortgage rates connect, see Issue 03: Do Fed Rate Hikes Move Your Mortgage?[15]
Oil prices are also playing a role. Brent crude dipped just below $100 a barrel early this week and climbed back to about $102 by Wednesday.[4][13] When energy prices rise, concerns about inflation tend to rise with them, which puts upward pressure on rates. Higher rates are already affecting buyers, as mortgage applications for both home purchases and refinances are running below last year's levels.[5]
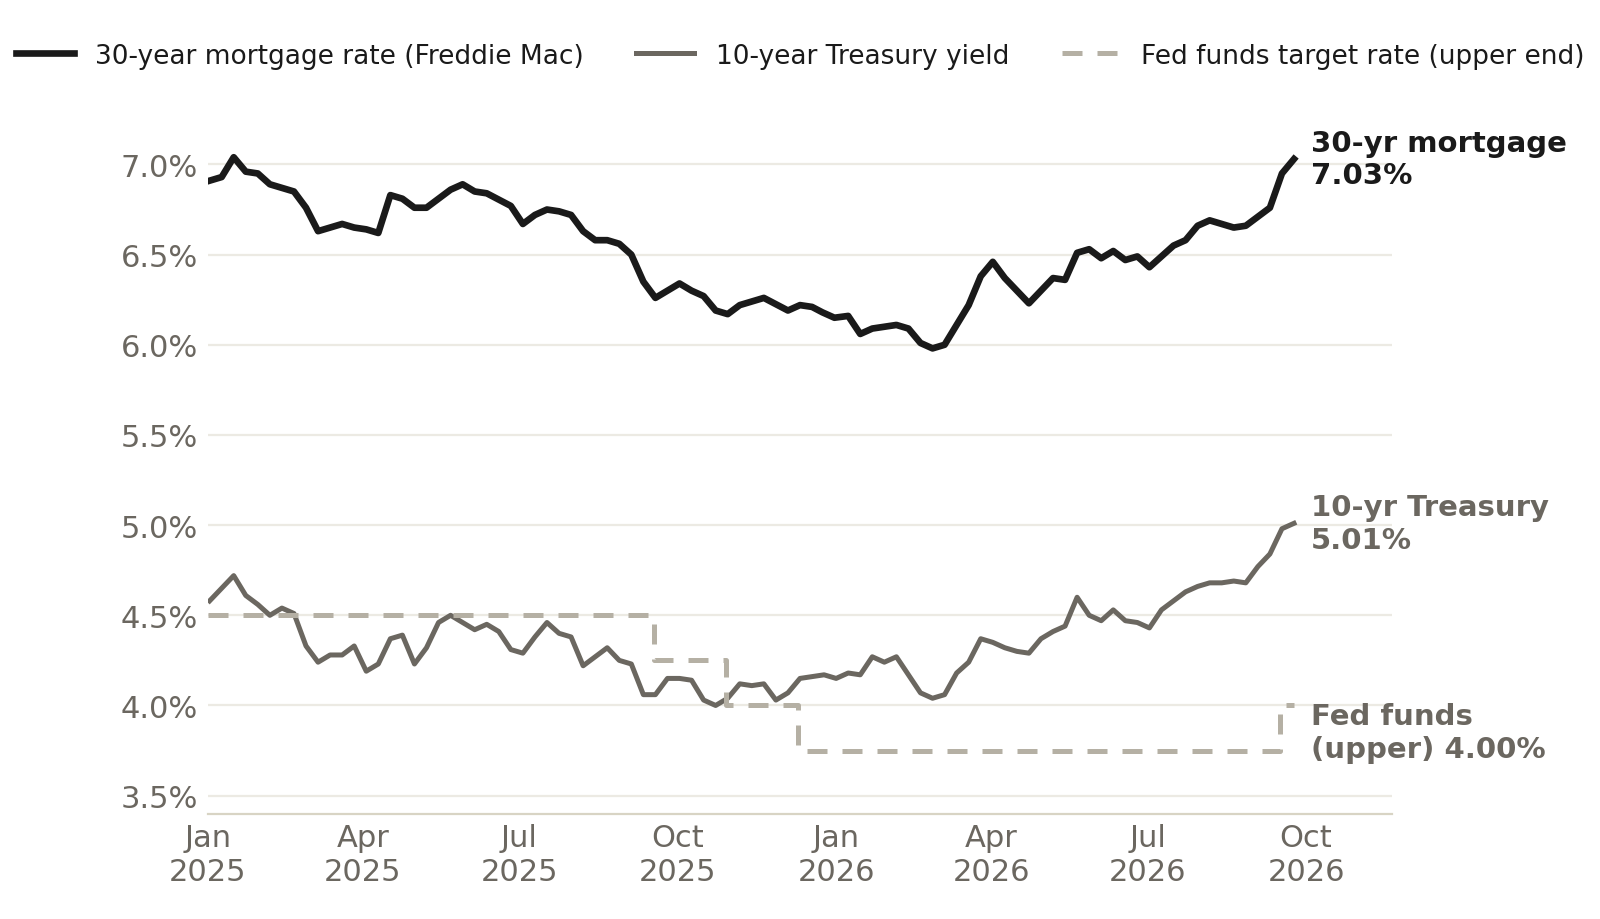
Figure 1. Mortgage rates follow the 10-year Treasury more closely than the Fed. Weekly averages, January 2025 to September 24, 2026. Data: Freddie Mac PMMS (30-year fixed), U.S. Treasury (10-year yield) and Federal Reserve Board (fed funds target, upper bound), via FRED.[14] Chart by The QUONAE Group. How to read it: the black line (30-year mortgage) moves with the gray line (10-year Treasury). The dashed line (the Fed's rate) stayed flat from December 2025 until the September 2026 hike, while mortgage rates rose about a full point, from 5.98% in late February to 7.03%.
| Week ending | 30-yr mortgage | 10-yr Treasury | Fed funds target (upper) |
|---|---|---|---|
| Jan 2, 2025 | 6.91% | 4.58% | 4.50% |
| Jun 26, 2025 | 6.77% | 4.31% | 4.50% |
| Sep 18, 2025 | 6.26% | 4.06% | 4.25% |
| Jan 1, 2026 | 6.15% | 4.15% | 3.75% |
| Feb 26, 2026 | 5.98% | 4.04% | 3.75% |
| Jun 25, 2026 | 6.49% | 4.46% | 3.75% |
| Sep 10, 2026 | 6.76% | 4.84% | 3.75% |
| Sep 17, 2026 | 6.95% | 4.98% | 4.00% |
| Sep 24, 2026 | 7.03% | 5.01% | 4.00% |
Weekly averages. Sources: Freddie Mac PMMS (MORTGAGE30US), U.S. Treasury (DGS10), Federal Reserve Board (DFEDTARU), via FRED. The 30-yr value shown for Jan 1, 2026 is the Dec 31, 2025 survey.
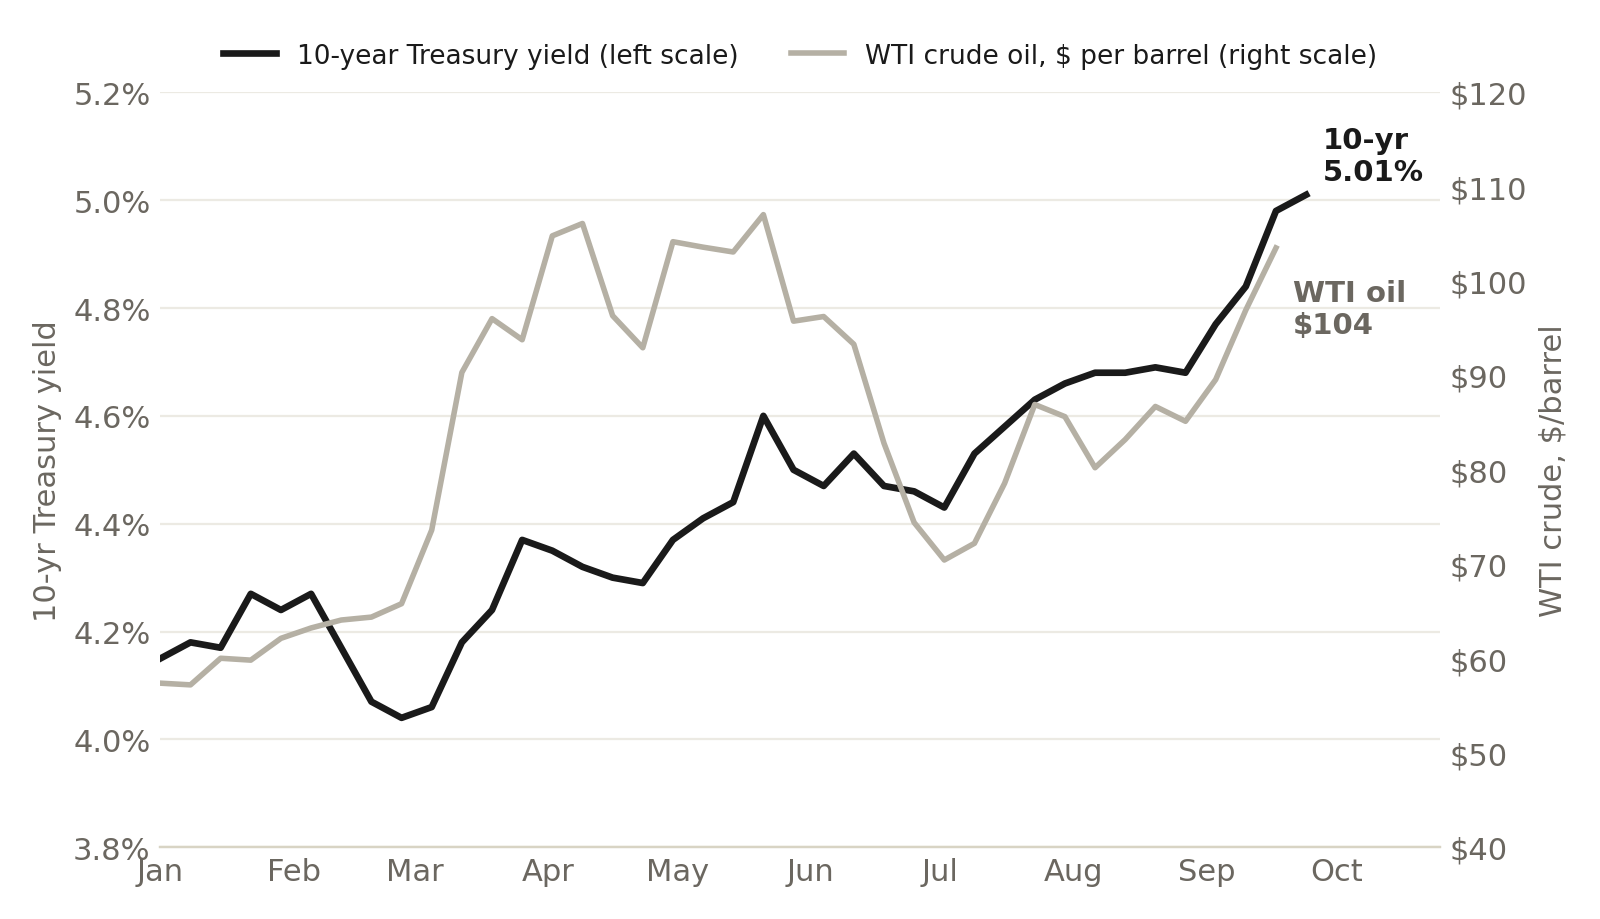
Figure 2. 10-year Treasury yield vs. WTI crude oil, 2026. Weekly averages, January to September 2026 (oil data runs through the week of September 17). Data: U.S. Treasury and U.S. Energy Information Administration, via FRED.[14] Chart by The QUONAE Group. How to read it: a yield is the interest rate investors earn for lending money to the U.S. government, and the 10-year yield is the rate on a 10-year loan. Mortgage lenders watch it closely, so when it rises, mortgage rates usually rise too. Since July, oil (light line) and the 10-year yield (black line) have climbed together. When energy prices go up, investors worry that inflation will rise, so they ask for a higher yield, and mortgage rates tend to follow. The two don't always move at the same time, though. In March, for example, oil jumped sharply while yields rose more slowly.
| Week ending | 10-yr Treasury | WTI crude ($/barrel) |
|---|---|---|
| Jan 1, 2026 | 4.15% | $57.39 |
| Mar 5, 2026 | 4.06% | $73.61 |
| Apr 9, 2026 | 4.32% | $106.10 |
| May 21, 2026 | 4.60% | $107.04 |
| Jul 2, 2026 | 4.43% | $70.44 |
| Aug 6, 2026 | 4.68% | $80.22 |
| Sep 17, 2026 | 4.98% | $103.51 |
| Sep 24, 2026 | 5.01% | not yet published |
Weekly averages. Sources: U.S. Treasury (DGS10) and U.S. Energy Information Administration (DCOILWTICO), via FRED.
A note on the numbers: rate figures can differ slightly depending on the source. Freddie Mac's survey averages a full week of loan applications, which put the rate at 6.95% on September 17 and 7.03% on September 24.[1] Daily trackers move faster and tend to run a little higher, showing 7.1% on September 23[2] after a one-day high of 7.24% on September 16.[12] The exact decimals change from day to day, but the trend is the same: rates are at their highest level since early 2025.
If you're shopping for a home, you have more choices than you did a year ago.[7]
Most of that growth comes from homes staying on the market longer as buyers pull back, rather than from more owners deciding to sell. Supply also varies widely by city. Some metros, such as Chicago and Pittsburgh, still have far fewer homes for sale than before the pandemic.[8]
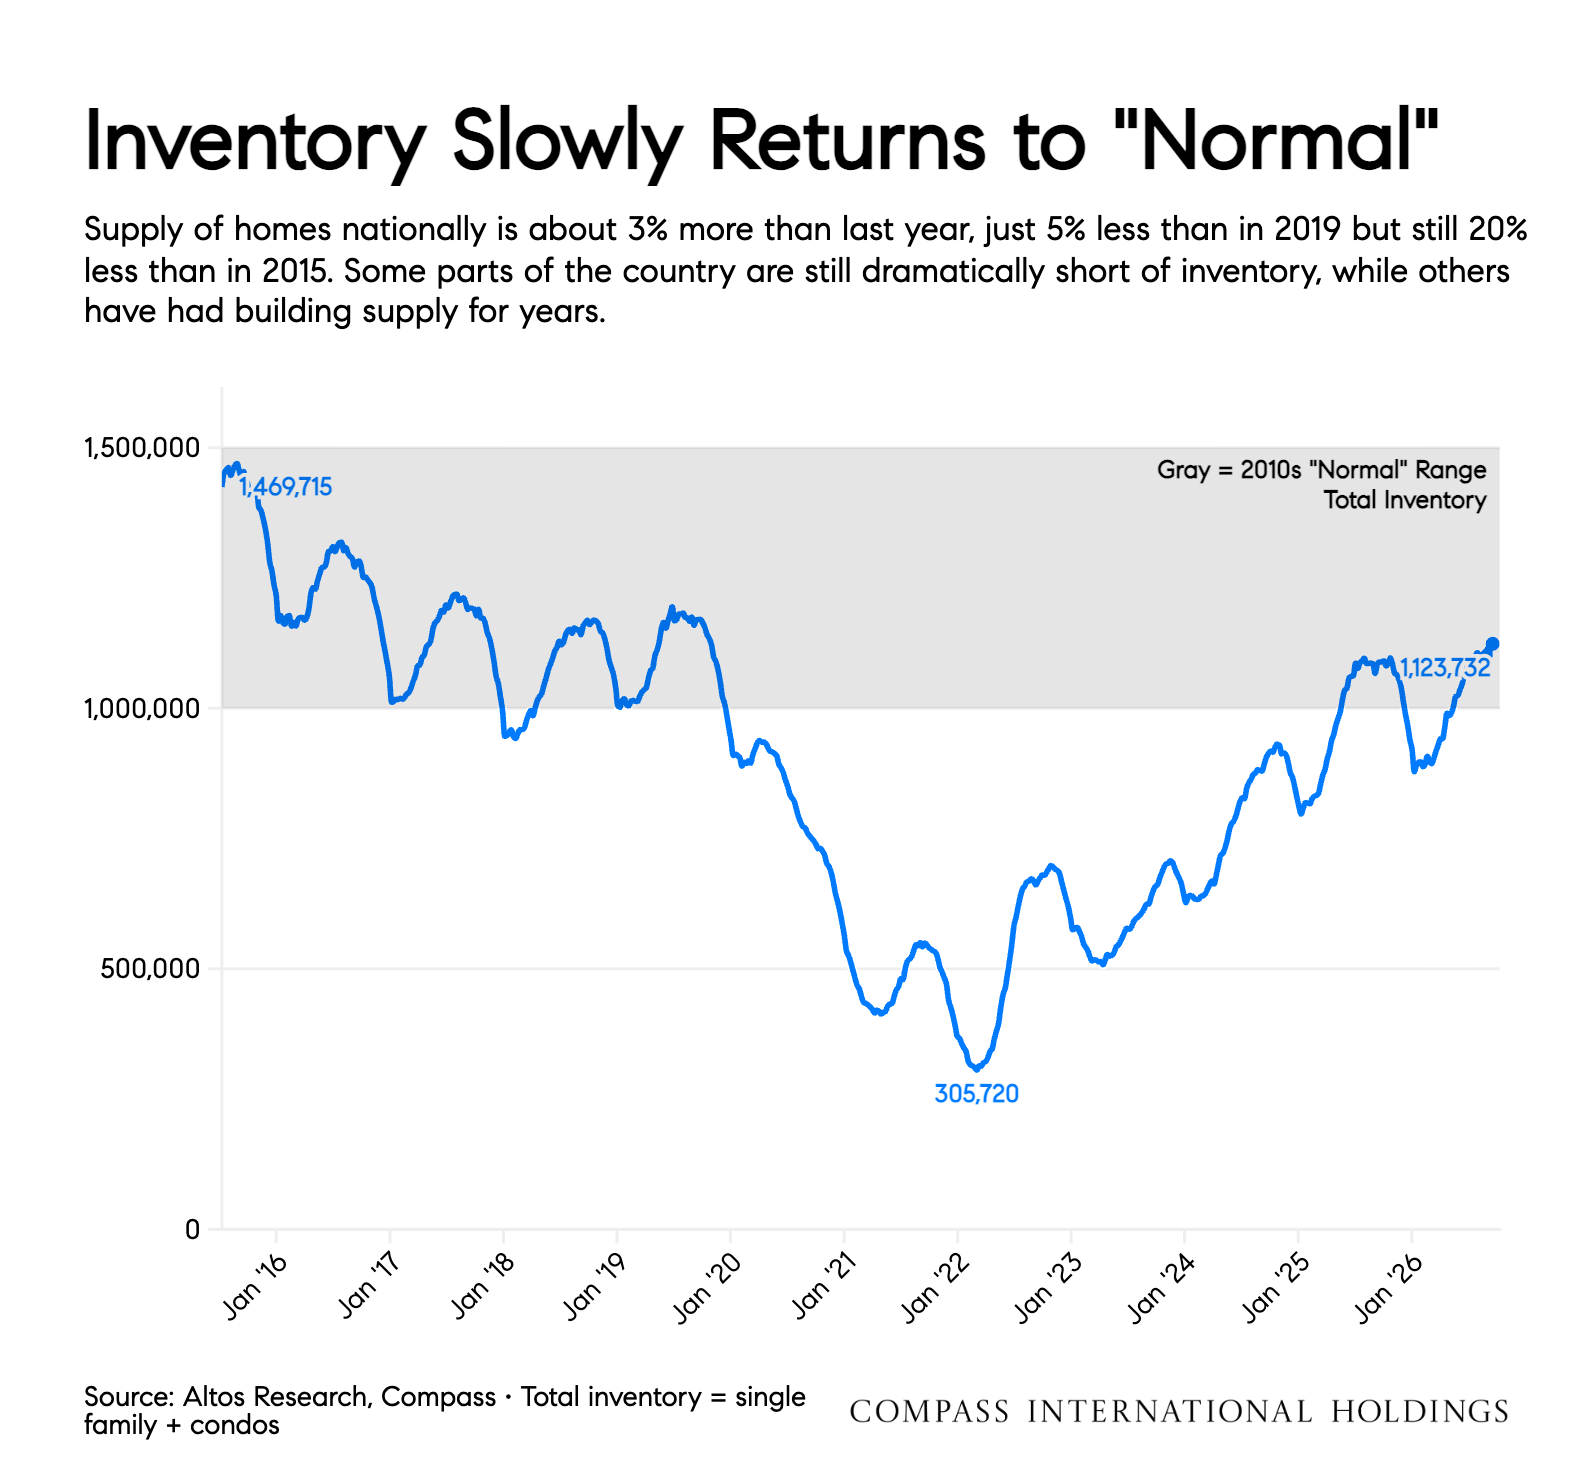
Figure 3. “Inventory Slowly Returns to ‘Normal.’” Chart: Compass International Holdings; data: Altos Research, single-family + condo, 2016 to today.[7] How to read it: the gray band is the “normal” range of the 2010s. The blue line has climbed back into it after the pandemic-era shortage.Legend: blue line = total U.S. homes for sale (single-family and condo); gray band = the 2010s normal range, roughly 1 to 1.5 million homes.
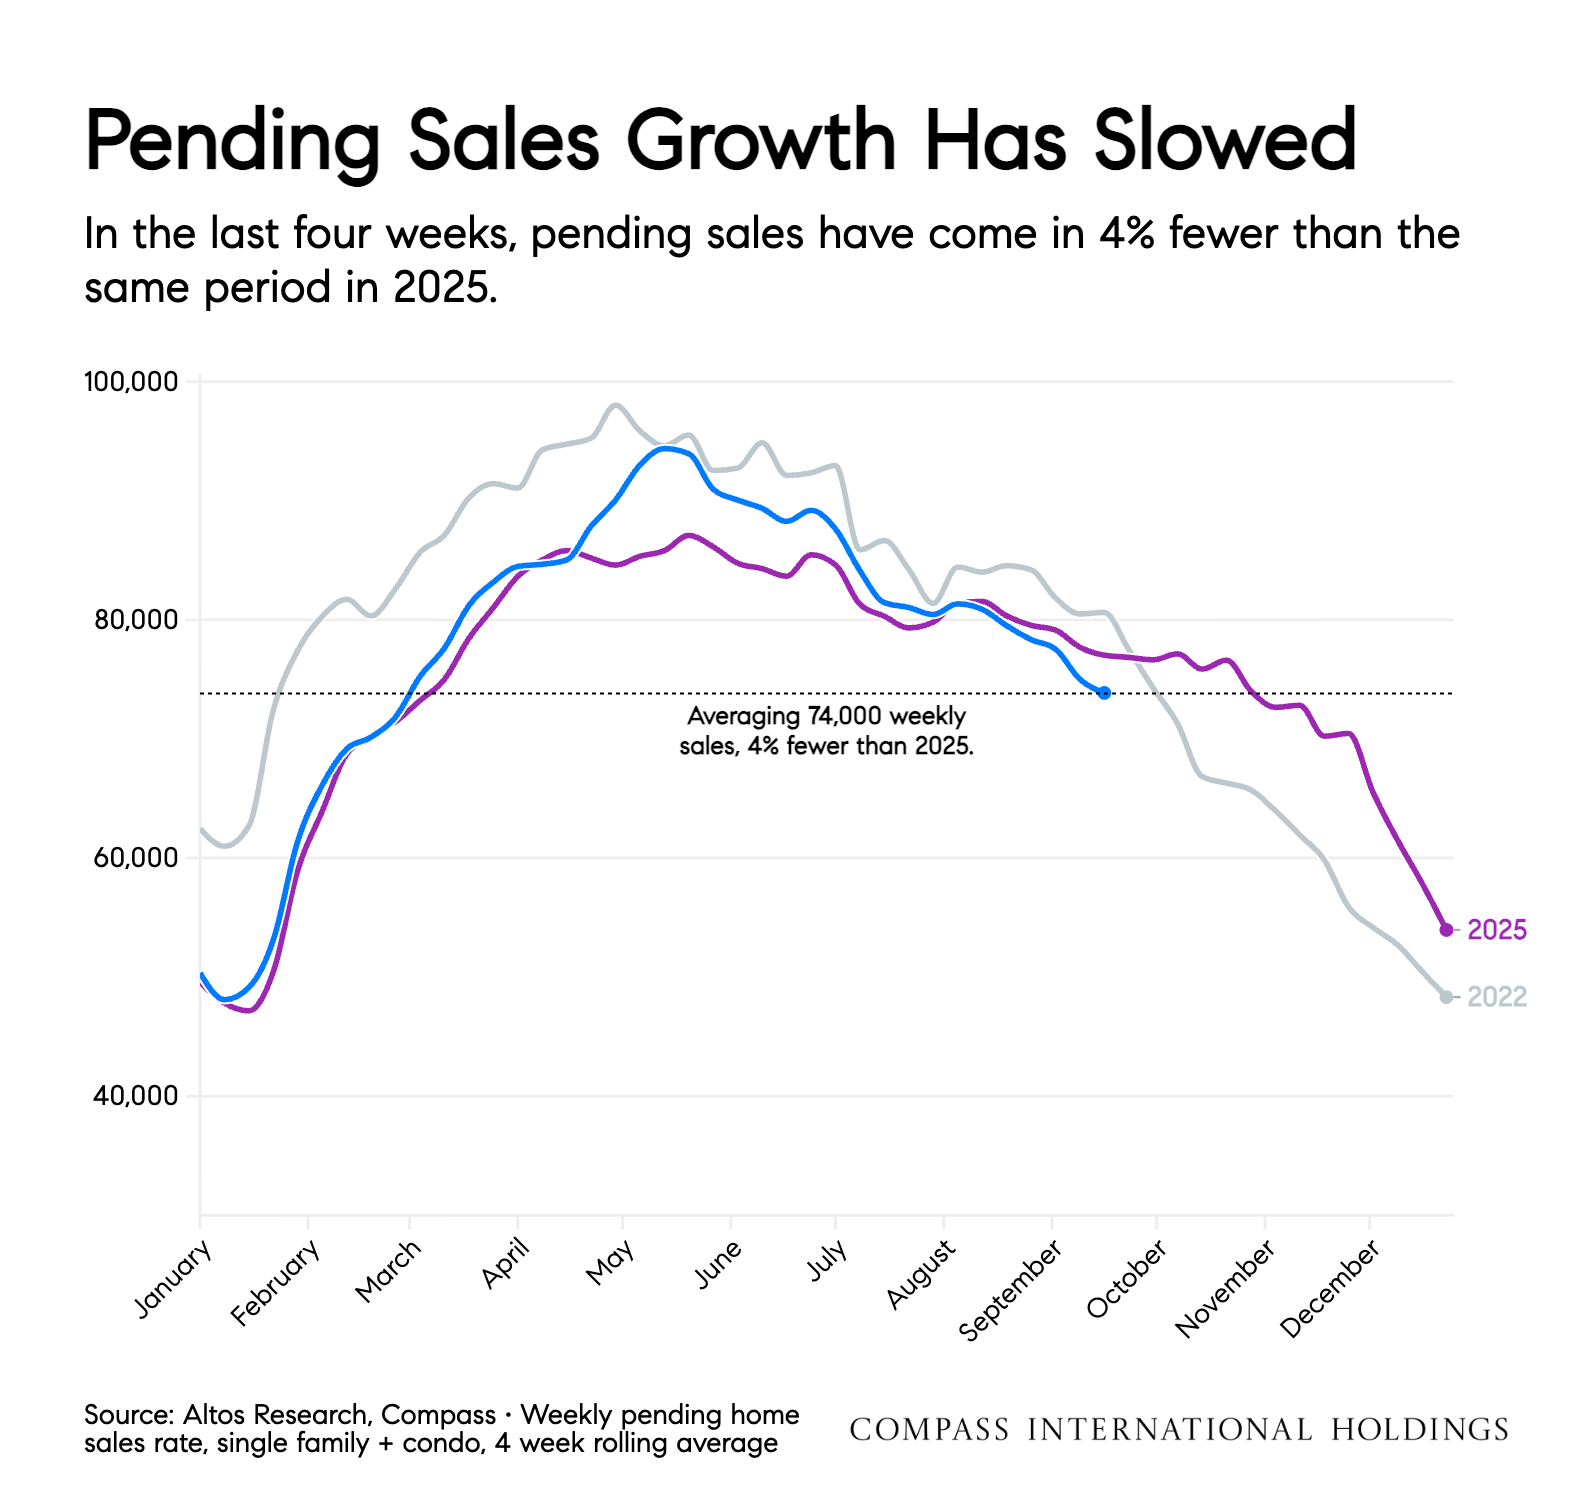
Figure 4. “Pending Sales Growth Has Slowed.” Chart: Compass International Holdings; data: Altos Research, weekly pending sales, 4-week average.[7] How to read it: the blue line is 2026 and the purple line is 2025. Blue dipping below purple means fewer sales than last year, about 4% fewer lately.Legend: blue = 2026; purple = 2025; light gray = 2022. The dotted line marks the recent average of about 74,000 pending sales a week.
Home prices haven't moved much yet. Nationally, the median price of a home going under contract is about $398,000, nearly the same as a year ago.[7] The Boston area looks similar. In the Boston-Cambridge-Newton metro, the median listing price was $795,000 in August 2026, about 0.6% lower than a year earlier, while the number of homes for sale rose about 15% to 7,990 and the typical listing spent 51 days on the market, up from 45.[16] Prices usually lag behind a slowdown because sellers are reluctant to lower them, a pattern Compass Research calls “downside stickiness.”[12] That makes prices the number to watch this fall.
Price reductions tell more of the story. More than 42% of homes for sale have already lowered their asking price, which is high for September.[7] It's a strong sign that pricing a home correctly from the first day matters more now than it has in years, compared with starting high and adjusting later.
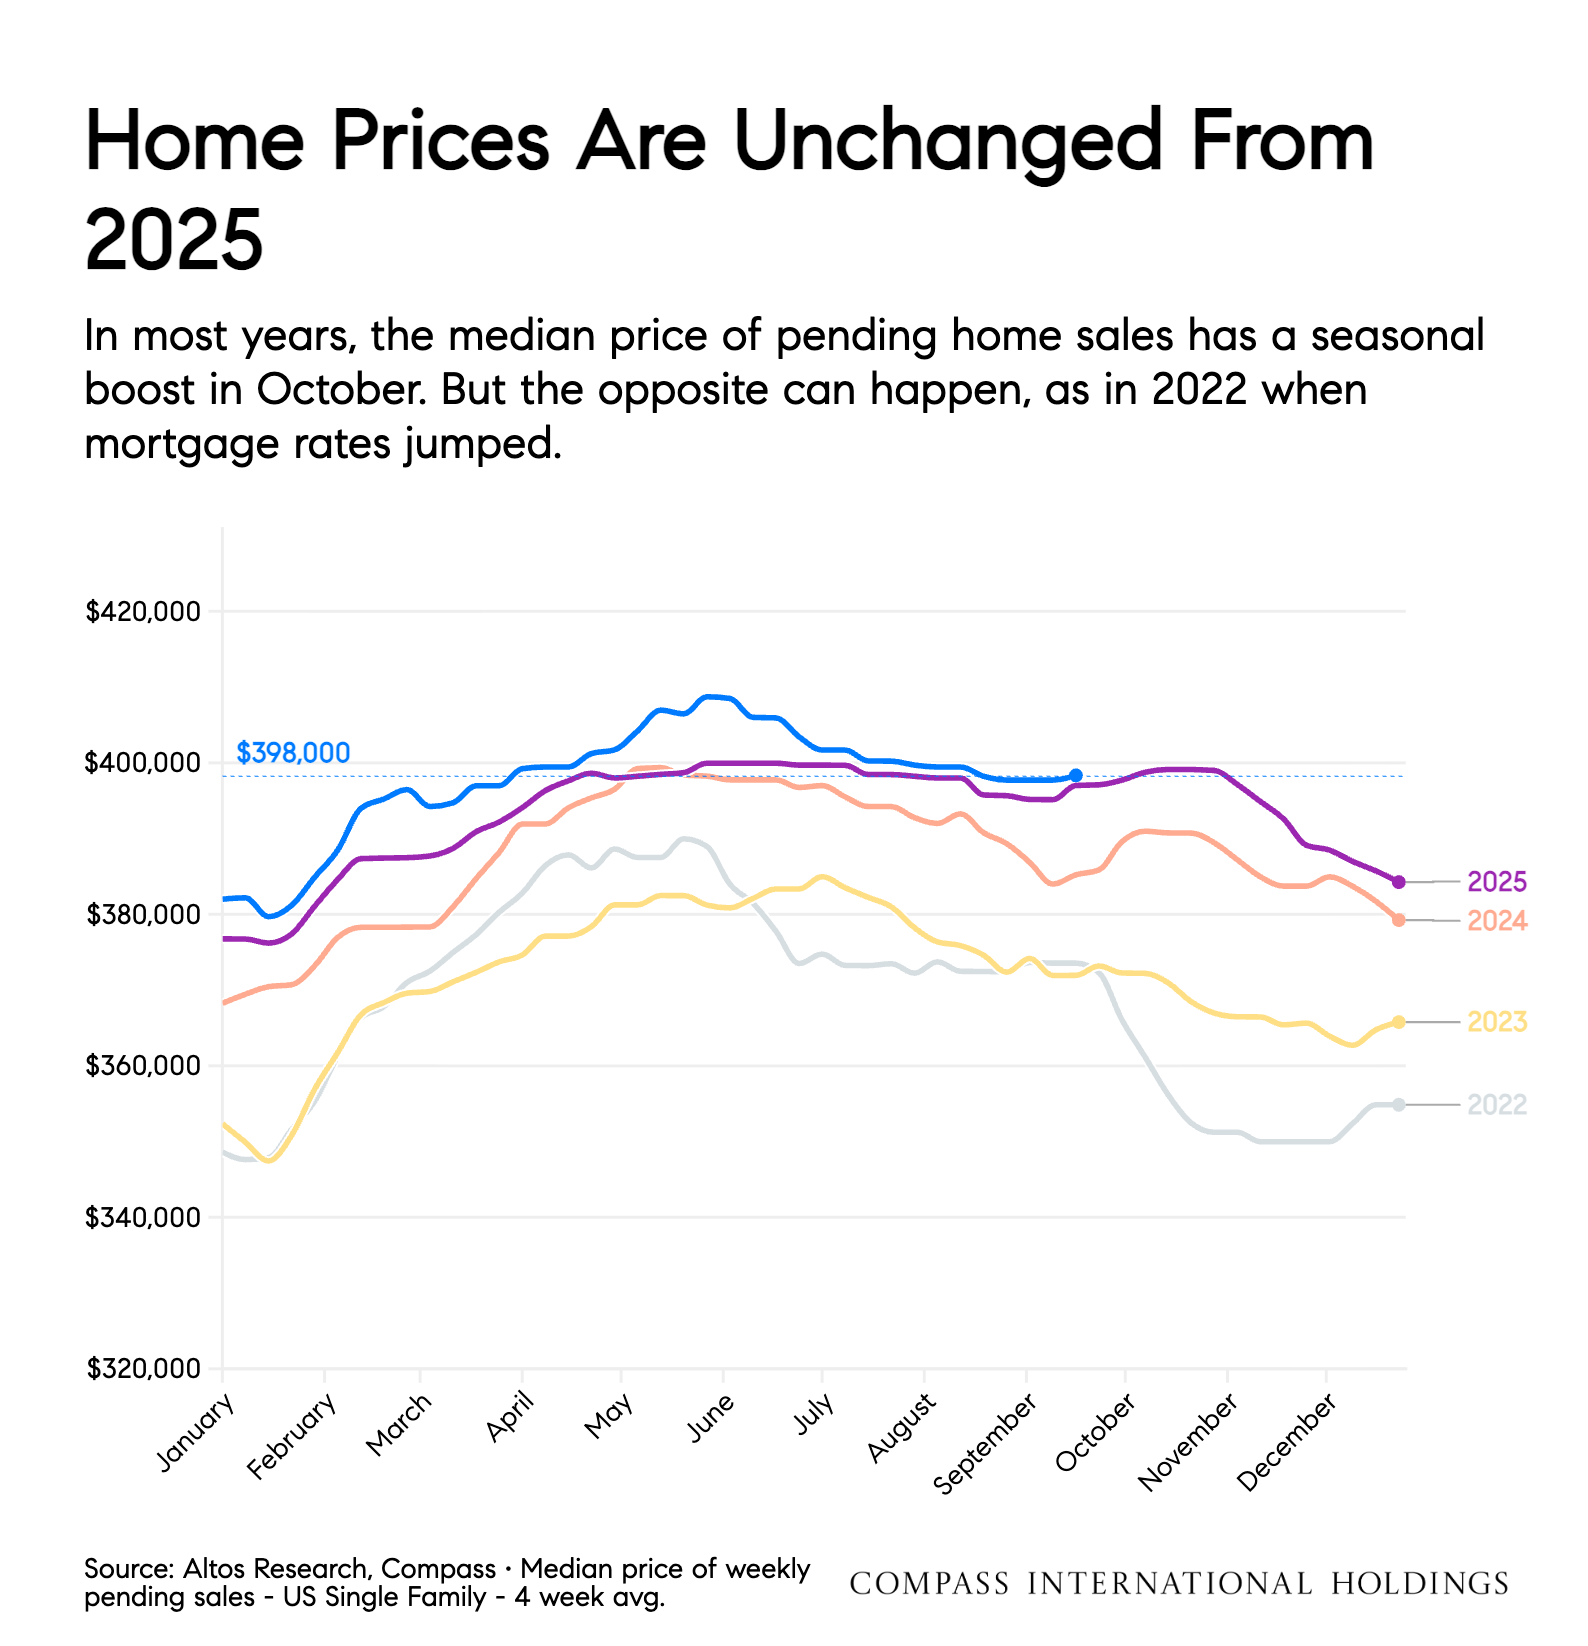
Figure 5. “Home Prices Are Unchanged From 2025.” Chart: Compass International Holdings; data: Altos Research, median price of pending sales, single-family, 4-week average, 2022–2026.[7] How to read it: blue is 2026, sitting right on top of 2025 (purple). The scale starts at $320,000, so small wiggles look bigger than they are.Legend: blue = 2026; purple = 2025; orange = 2024; yellow = 2023; light gray = 2022. This chart covers single-family homes only.
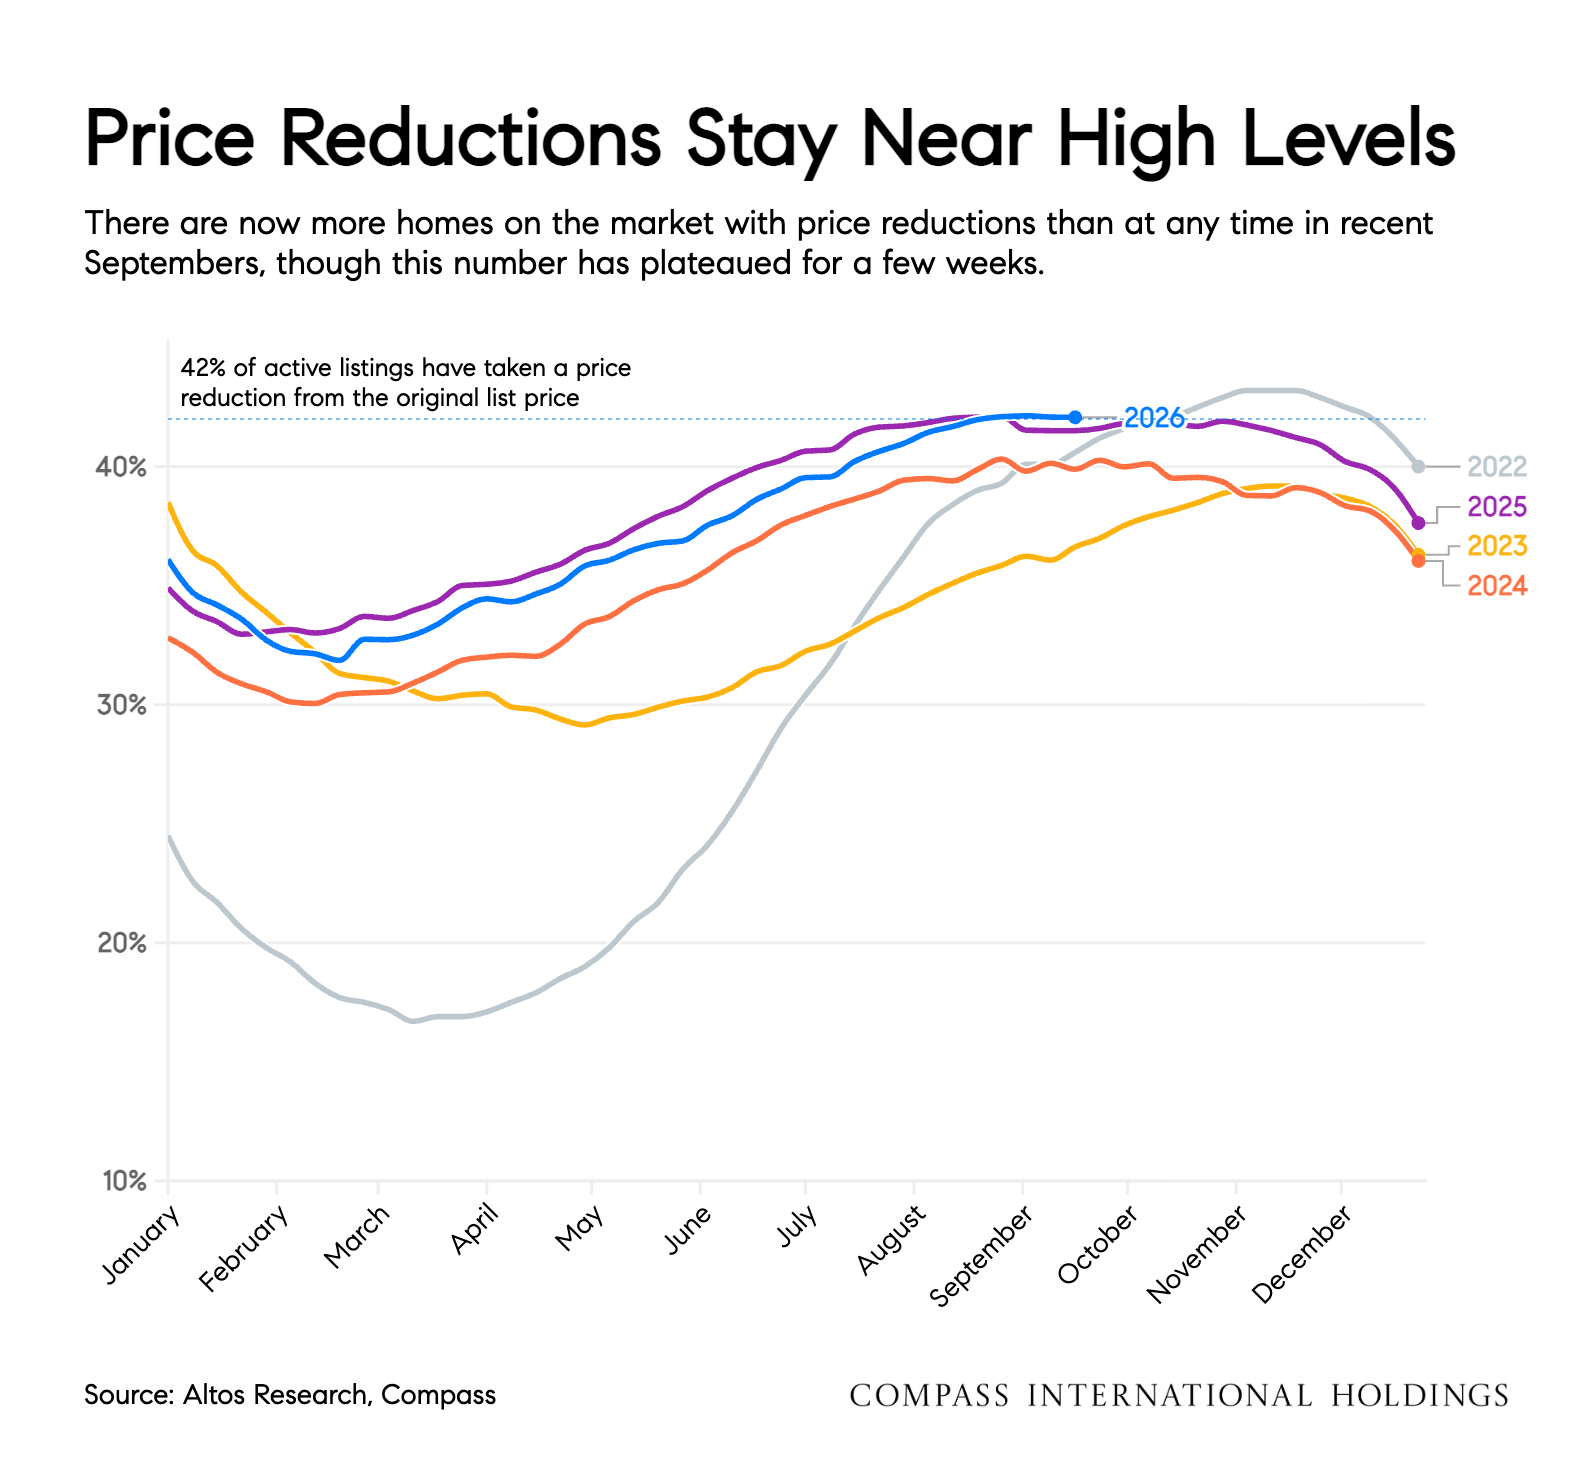
Figure 6. “Price Reductions Stay Near High Levels.” Chart: Compass International Holdings; data: Altos Research, share of active listings with a price cut.[7] How to read it: blue (2026) is level with last year's high (purple) and above 2023 and 2024.Legend: blue = 2026; purple = 2025; orange = 2024; yellow = 2023; light gray = 2022. The dotted line marks 42%.
| Figure | Measure | Value shown |
|---|---|---|
| 3 | Total U.S. homes for sale (latest) | 1,123,732 |
| 3 | Pandemic-era low (2022) | 305,720 |
| 3 | 2010s “normal” range | about 1.0 to 1.5 million |
| 4 | Weekly pending sales, 4-week average | about 74,000 (4% below 2025) |
| 5 | Median price of pending sales, single-family | about $398,000 |
| 6 | Share of active listings with a price cut | about 42% |
Values as labeled on the Compass International Holdings charts (Altos Research data), used with permission.
A quick note on these numbers: the figures above come from weekly data on homes currently for sale. The government's official report runs about a month behind but tells a similar story. It counted 1.62 million homes for sale in August and put the median price of homes that had already sold at $429,100.[6] The two reports measure different things, so they won't match exactly. One shows where the market is heading, and the other confirms where it has been. Both point in the same direction, with more homes available and buyers taking longer to commit.
Higher rates have also given buyers more leverage than they've had in years.[10] When fewer buyers are shopping, homes stay on the market longer and sellers become more willing to negotiate. That can include the price, closing costs, repairs, and contingencies that sellers would have turned down eighteen months ago.
Housing economist Mike Simonsen's weekly data shows this effect. With daily mortgage rates near 7.2%, the highest since May 2024, the number of homes going under contract is running about 4% behind last year's pace.[8] That 7.2% is a daily figure, which is slightly higher than Freddie Mac's weekly average (see the note on the numbers above).
If you've been waiting for rates to come down, it may be worth looking at what's negotiable today instead.
More homes are on the market mainly because they're selling more slowly, not because more owners are listing. Higher monthly payments are stretching buyers' budgets, and that changes which questions are worth asking on either side of a deal.[7][8]
If you're waiting for rates to drop before you buy, consider exploring what's available right now:
Waiting may still be the right choice for you, and we're happy to help you weigh it with real numbers.
Mortgage rates follow the 10-year Treasury yield, which reached about 5%, its highest level in almost 20 years. Rising oil prices have added to inflation concerns, and the Federal Reserve raised its benchmark rate to a range of 3.75% to 4.00% on September 16, 2026. Freddie Mac’s weekly average was 7.03% on September 24.
Yes. Altos Research data show about 1.12 million homes for sale nationally, up about 3% from a year earlier, mainly because homes are selling more slowly. The National Association of Realtors counted 1.62 million homes for sale in August 2026.
Not yet. Nationally, the median price of homes going under contract is about $398,000, nearly unchanged from a year ago, and NAR reported a $429,100 median sale price for August 2026. However, about 42% of listings have cut their asking price, which is high for September. In the Boston-Cambridge-Newton metro, the median listing price was $795,000 in August 2026, about 0.6% lower than a year earlier, according to Realtor.com data published by the St. Louis Fed.
Nicole Protheroe is not a licensed loan officer. Rate, loan, and buydown information in this brief is based on the cited sources, which are subject to change. For guidance on your own loan, please speak with a licensed loan officer.
Where sources disagreed — the exact 30-year rate on a given day, or Altos's pending-contract price vs. NAR's closed-sale price — this brief reports both figures and explains the difference rather than picking one. All figures are point-in-time and subject to change; verify against the live source before republishing or relying on them for a transaction.
The only quoted phrase (“downside stickiness,” Compass Research) appears in quotation marks with a citation and was checked word for word against the source on September 24, 2026. Everything else is written in original words; where a sentence restates a source's finding, the source is cited in brackets. Figures 1–2 were built by The QUONAE Group from public FRED data, with every point pulled directly from the source series and checked against the Freddie Mac and Federal Reserve figures cited in the text. Figures 3–6 are Compass International Holdings charts (data from Altos Research), used with permission; each caption gives the chart's original title and source.
“About a full point”
Boston area, August 2026 vs. August 2025
Listing prices are asking prices, not final sale prices; the national $398,000 figure is the median price of homes going under contract.