Higher Rates, Higher Rent? Understanding the Rent "Doom Loop"
Questions this brief answers
- Can higher interest rates push rents up, and not only home prices?
- What is the "higher rates, higher rent doom loop" that economists are talking about?
- What do rent and construction numbers show right now?
Key takeaways
- Research from the Federal Reserve Board and Columbia Business School finds that rents tend to rise after surprise interest rate increases, because more households keep renting instead of buying.7,8
- From January to August 2026, builders finished apartments at a pace of about 417,000 units a year, 27.7% slower than in the same months of 2024. This reflects the drop in new building projects that followed the 2022 to 2023 rate increases.5
- Rents are not surging today. The government's rent index rose 2.7% in the year to August 2026, and 7.3% of rental homes are sitting empty, the highest share since 2017.3,6
Higher interest rates can raise rents, and research from the Federal Reserve Board and Columbia Business School supports this. The effect builds slowly, usually over a year or two, and other forces can outweigh it. In 2024 and 2025, a large wave of newly built apartments held down rents on new leases even though rates were high.
What is the "doom loop"?
In an October 4, 2026 note, Torsten Slok, chief economist at the investment firm Apollo, warned about what he called the "higher rates, higher rent doom loop." He wrote that "when rates are high, builders build less, and when fewer homes and apartments get built, rents go up, which pushes inflation higher and keeps rates high."1 Rent carries a lot of weight in that cycle because rent and the closely related "owners' equivalent rent" (the government's estimate of what homeowners would pay to rent their own home) make up a large share of the Consumer Price Index (CPI), the government's main measure of how fast everyday prices are rising, so higher rents keep the official inflation rate up. Higher inflation, in turn, makes it harder for the Federal Reserve to lower rates, and the cycle starts again.1,2
Slok's warning came a few weeks after the Federal Reserve raised its key short-term interest rate, the federal funds rate, by 0.25 percentage points to a range of 3.75% to 4.00% on September 16, 2026.12 In Freddie Mac's weekly survey, the 30-year fixed mortgage rate averaged 7.28% for the week of October 1, 2026, up from 6.34% a year earlier.13 If you'd like a refresher on how the Fed's rate and mortgage rates relate, see Issue 03: Do Fed Rate Hikes Move Your Mortgage?
Is it true that higher rates raise rents?
The idea seems backward at first, since higher rates are meant to cool prices. Rental housing behaves differently from most of what we buy, and economists have found two ways rising rates can push rents up.
1. More people keep renting
When mortgage rates rise, owning gets more expensive, so some households who would have bought a home stay in their rentals. In a 2019 study, Federal Reserve Board economists Daniel Dias and João Duarte looked at price data from the 1980s to 2017. They found that after a rate increase that markets did not see coming, almost every everyday price they tracked fell or held steady except rent, which rose. They also found that fewer rentals sat empty and fewer people owned homes, which suggests households were renting instead of buying.7 A 2025 study by Boaz Abramson of Columbia Business School, with Pablo De Llanos and Lu Han, used more than 30 million rental listings from 2011 to 2022. It found that a 0.25 percentage point rise in the 30-year mortgage rate was followed by a 1.4% rise in rents within 24 months, or 1.7% once general inflation is taken into account.8
2. Builders build less
Apartment developers usually borrow to build, so higher rates raise their costs and some projects no longer make financial sense. Those projects also take a while to build. According to the Census Bureau, buildings with two or more units took an average of 16.5 months to finish in 2025, counting from the day construction began. Large buildings with 20 or more units took about 22 months from the day they got a building permit to the day they were finished.14 That means fewer projects breaking ground today leads to fewer apartments ready to rent about a year and a half to two years later. Figure 2 shows this pattern. The number of apartments where construction began peaked in 2022 and dropped sharply in 2024 after the Fed's rate increases. The number of apartments finished peaked in 2024 and has been falling since.4,5

View the data
| Year (Jan–Aug avg.) | Began construction (thousands, annual rate) | Finished (thousands, annual rate) |
|---|---|---|
| 2018 | 369.0 | 361.0 |
| 2019 | 367.1 | 356.6 |
| 2020 | 399.4 | 333.9 |
| 2021 | 449.4 | 372.8 |
| 2022 | 521.0 | 335.0 |
| 2023 | 490.4 | 427.1 |
| 2024 | 333.9 | 577.1 |
| 2025 | 391.6 | 492.1 |
| 2026 | 430.9 | 417.4 |
So why aren't rents soaring?
The same construction data also explains why the loop has been slower than it sounds. The building boom that started in 2021 and 2022 led to the most apartments finished since 1974 (comparing January to August of each year), and all of that new supply gave renters more choices. The share of rental homes sitting empty, called the rental vacancy rate, rose from 5.6% at the end of 2021 to 7.3% in the first half of 2026, the highest level since 2017.6 With more empty units, landlords have had less room to raise rents.
As Figure 3 shows, the government's rent index rose 2.7% in the year to August 2026, down from 7.8% in 2023.3 Rents advertised on newly listed apartments react faster than the government's index, and they have barely moved. Apartment List's national median rent was $1,388 in September 2026, 0.4% lower than a year earlier. That yearly decline has gotten smaller every month since April, when rents were 1.6% lower than a year before.10 Joel Berner, chief economist at Realtor.com, told Moneywise that it is "really only a 'doom loop' if there are no forces acting against it," pointing out that builders tend to build more rental units as rents rise. He also said he sees the problem as "a few years down the road" rather than imminent.11
Some Federal Reserve research also points the other way over longer periods. A 2023 San Francisco Fed study by Zheng Liu and Mollie Pepper, using data from 1988 to 2019, found that raising rates can also slow rent increases over time by cooling demand for housing overall. They estimated that a 1 percentage point rise in the federal funds rate could shrink the yearly rent increase by up to 3.2 percentage points over about two and a half years.9 Rates affect rents from more than one direction, and which force wins depends on the timing and the local market.

View the data
| August of | Rent index (1982–84 = 100) | Change from prior August |
|---|---|---|
| 2018 | 320.651 | +3.6% |
| 2019 | 332.638 | +3.7% |
| 2020 | 342.444 | +2.9% |
| 2021 | 349.710 | +2.1% |
| 2022 | 373.283 | +6.7% |
| 2023 | 402.247 | +7.8% |
| 2024 | 422.223 | +5.0% |
| 2025 | 436.981 | +3.5% |
| 2026 | 448.997 | +2.7% |
What it could mean next
Because apartment buildings take about a year and a half to two years to finish, the new apartments opening today mostly reflect decisions builders made in 2024 and early 2025. That delay is why the first part of the loop is only now showing up for renters.
The drop is clearest in the most recent month. In August 2026, builders finished apartments at a pace that would add up to about 302,000 units over a full year, 35.7% fewer than the pace in August 2025.5 With fewer new apartments opening and mortgage rates above 7%, renters could have fewer choices over the next year or two, which could push rents up. On the other hand, builders have broken ground on more apartments in 2026, which could add supply again in 2027 and 2028. No one can predict with certainty where rents or rates will go.
For renters, this may mean less negotiating room at renewal than in the past two years. For buyers, the gap between renting and owning is one input to weigh alongside rates, which we covered in Issue 04: Rates vs. Inventory. For sellers and landlords, steadier rents can support what investors are willing to pay for rental property. This information is useful to buyers and sellers alike.
Meanwhile, the for-sale market is cooling
The same high rates that affect rents are also slowing home sales. Many buyers have decided to wait until spring, so fewer homes are going under contract each week, and more sellers are lowering their asking prices. The numbers below come from Altos Research and Compass and cover the week of October 12, 2026. They are national figures for the whole country, not for Greater Boston.15
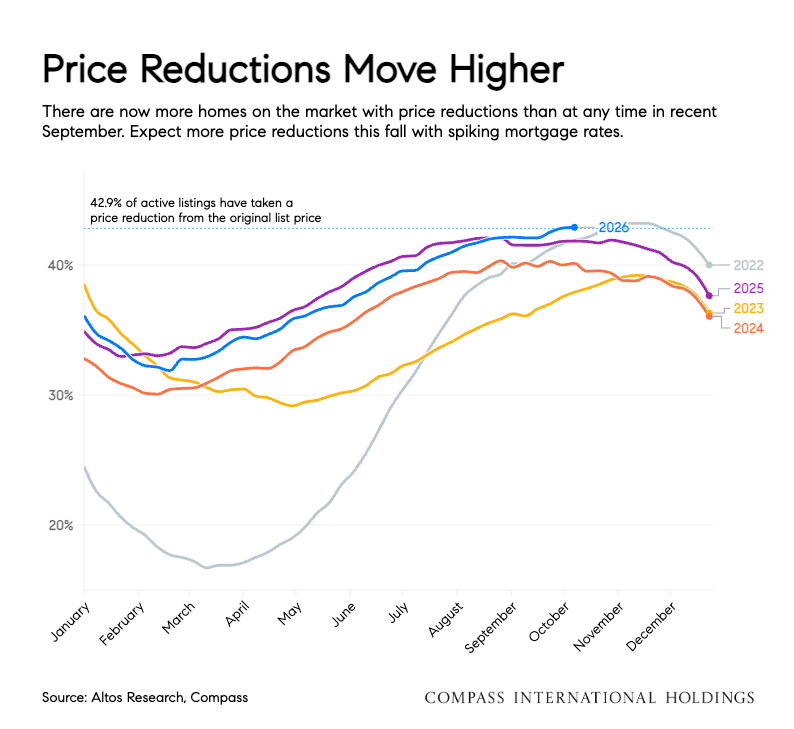
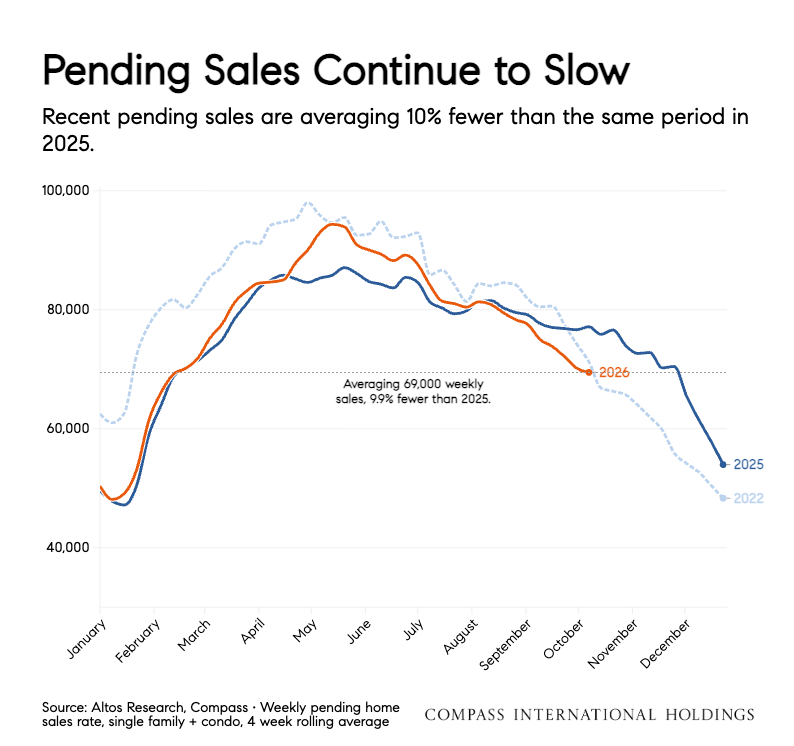
Price cuts are now more common than in any October in more than ten years, and we expect the share of listings with a cut to pass its November 2022 level by the end of this month. The average cut of 4.2% is bigger than last year's but smaller than in 2022 and 2023. New contracts have averaged about 69,000 a week over the past four weeks, 9.9% fewer than at the same time last year. None of these weekly measures have started to improve yet, so the slowdown could continue into 2027, which may bring new pricing trends and headlines next year. No one can predict the market with certainty.15
View the data
| Measure | Value |
|---|---|
| Listings with a price cut, Oct. 2026 | 42.9% |
| Average price cut | 4.2% |
| Average cut on a $435,000 home (our calculation) | about $18,000 |
View the data
| Measure | Value |
|---|---|
| New contracts, 4-week average, Oct. 2026 | 69,000 |
| Change vs. same period 2025 | −9.9% |
| New contracts, latest single week | 64,000 |
| Change vs. a year ago (single week) | −16% |
View the data
| Measure | Value |
|---|---|
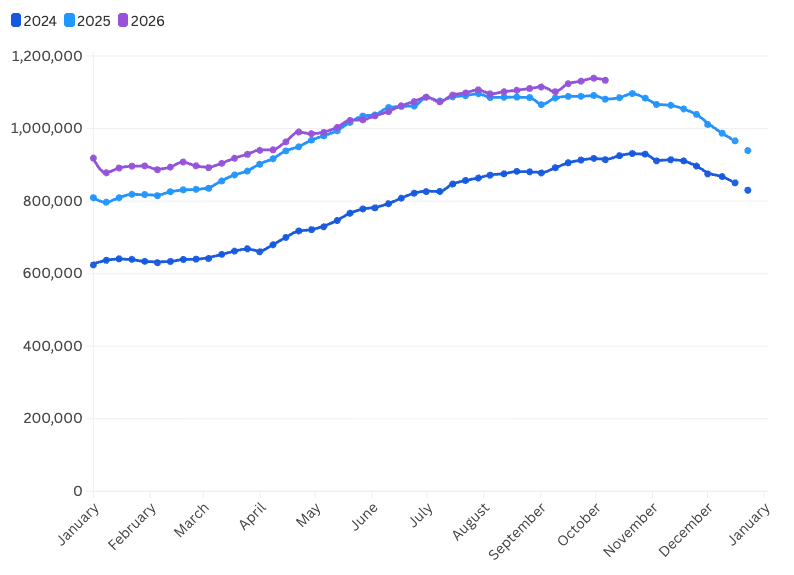
| Homes for sale, Oct. 2026 | 1.13 million |
| Change vs. a year ago | +4.8% |
| New listings this week | 77,000 |
| New listings, same week last year | 78,000 |
View the data
| Measure | Value |
|---|---|
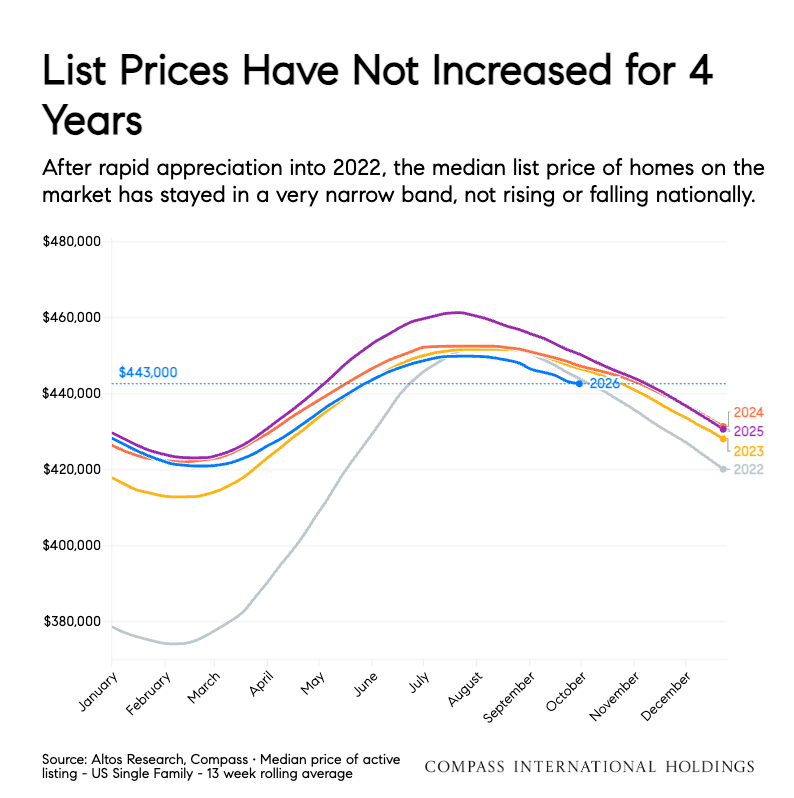
| Median asking price, 13-week average (chart) | $443,000 |
| Median asking price, this week | $435,000 |
| Change vs. a year ago | −1.1% |
A slower sales market connects back to rents. When buyers wait, more of them keep renting, which is the first part of the loop described above. Keep in mind that these are national numbers, and price cuts are not rising at the same pace everywhere. Local markets, including the Greater Boston Area, its surrounding suburbs, and the North Shore, can look quite different. For more on how this fall compares with past years, see Issue 07: Fewer Offers, More Price Cuts.
The QUONAE Group follows rent, construction, sales and rate data closely and shares what we find with our clients through The QUONAE Brief. Reach out to find out more.
Common questions
Can higher interest rates make rent go up?
Yes, in two ways. Higher mortgage rates keep more people renting instead of buying, which adds rental demand, and higher borrowing costs lead builders to build fewer apartments, which shrinks future supply. Research from the Federal Reserve Board and Columbia Business School finds rents tend to rise after surprise rate increases. The effect is slow and can be outweighed by other forces, such as a wave of new apartments.
What is the "higher rates, higher rent doom loop"?
It is a phrase used by Apollo chief economist Torsten Slok in October 2026. High rates lead builders to build less, a shortage of new homes and apartments pushes rents up, higher rents push the official inflation rate up because rent is a large share of the Consumer Price Index, and higher inflation keeps the Federal Reserve from lowering rates.
Are rents rising quickly right now?
Not quickly. The government's rent index rose 2.7% in the year to August 2026, the slowest pace in this 2018 to 2026 comparison except 2021. Apartment List's asking-rent index was 0.4% lower in September 2026 than a year earlier, though its yearly change has been rising since April. The concern is that fewer new apartments are being finished, which could tighten the market over the next year or two.
Does this matter for buyers and sellers too?
Yes. Rent levels affect whether buying looks attractive compared with renting, what investors will pay for rental property, and how long the Federal Reserve keeps rates high. That information is useful to buyers, sellers and landlords alike.
Are home prices falling nationally?
Only slightly. The national median asking price was $435,000 in the week of October 12, 2026, 1.1% lower than a year earlier, according to Altos Research and Compass. More sellers are cutting prices, though. About 42.9% of homes for sale had a price cut, the highest share for any October in more than ten years.15
Ask us about our 1-0 buydown offer! Clients are always free to choose their own lender. Offer subject to change. Listed by The QUONAE Group at Compass. Equal Housing Opportunity.
References
- Slok, T. "The Higher Rates, Higher Rent Doom Loop Is a Big Problem for the Fed." Apollo Daily Spark, October 4, 2026. apollo.com
- Pringle, E. "Kevin Warsh's Fed has a rent problem: Higher rates could fuel a 'doom loop' in housing, top economist warns." Fortune, October 5, 2026. fortune.com
- U.S. Bureau of Labor Statistics. CPI-U: Rent of Primary Residence, U.S. City Average (CUUR0000SEHA), via FRED, retrieved October 10, 2026. fred.stlouisfed.org
- U.S. Census Bureau and HUD. Housing Units Started, 5 Units or More (HOUST5F), via FRED, retrieved October 10, 2026. fred.stlouisfed.org
- U.S. Census Bureau and HUD. Housing Units Completed, 5 Units or More (COMPU5MUSA), via FRED, retrieved October 10, 2026. fred.stlouisfed.org
- U.S. Census Bureau. Rental Vacancy Rate in the United States (RRVRUSQ156N), via FRED, retrieved October 10, 2026. fred.stlouisfed.org
- Dias, D. A. and Duarte, J. B. "Monetary Policy, Housing Rents, and Inflation." Federal Reserve Board, International Finance Discussion Papers No. 1248, May 2019. federalreserve.gov
- Abramson, B., De Llanos, P. and Han, L. "Monetary Policy and Rents." Summarized in Columbia Business School, "Higher Rates, Higher Rents: How Monetary Policy Affects Housing Costs," June 3, 2025. business.columbia.edu
- Liu, Z. and Pepper, M. "Can Monetary Policy Tame Rent Inflation?" FRBSF Economic Letter 2023-04, February 13, 2023. frbsf.org
- Apartment List. National Rent Report, September 2026 (published September 29, 2026). apartmentlist.com
- Boast, L. "The Fed risks triggering a 'doom loop' keeping rents high and homeownership out of reach, economist warns. Is he right?" Moneywise, October 7, 2026. moneywise.com
- Federal Reserve. FOMC statement, September 16, 2026. federalreserve.gov
- Freddie Mac. Primary Mortgage Market Survey, week of October 1, 2026. freddiemac.com
- U.S. Census Bureau, Survey of Construction (length of time from start to completion), as summarized by NAHB, "Shorter Apartment Construction Time in 2025," September 2026, and CalculatedRisk, June 17, 2026. census.gov · eyeonhousing.org · calculatedrisk
- Altos Research and Compass International Holdings. Weekly national housing market data and charts (price reductions, pending sales, inventory, new listings, median list price), as of October 12, 2026. Charts used with permission.
Nicole Protheroe is not a licensed loan officer. Rate and rent information is based on the cited sources, which are subject to change at any time. This brief is for general information only and is not financial, legal or tax advice. Figures labeled as calculated by The QUONAE Group are our own calculations from the cited public data. No one can guarantee future rents, rates or home values.
We encourage every client to research schools and communities independently. The QUONAE Group does not steer anyone toward or away from any school, neighborhood, or property.
The QUONAE Group is a team of real estate agents affiliated with Compass, a licensed real estate broker, and is not itself a licensed real estate broker. Agents are licensed in Massachusetts. Information is deemed reliable but not guaranteed. Equal Housing Opportunity. We are pledged to the letter and spirit of U.S. policy for the achievement of equal housing opportunity throughout the nation.